AI Chart Pattern Recognition for Triangles and Flags
Learn how AI identifies triangles flags and head and shoulders, how to validate signals, and how to trade patterns with defined risk.
By Trading AI Team

Key Takeaways
- AI chart pattern recognition works best when patterns are filtered by trend context, liquidity, and volatility regime rather than traded in isolation.
- Use a ruleset like “entry on breakout close, stop beyond invalidation, target at 1.0–1.5x measured move” to standardize execution across patterns.
- Automatic pattern detection is most reliable when the scanner confirms at least three swing touches per trendline and rising volume on the break.
- Head and shoulders signals improve when neckline slope, time symmetry, and retest behavior are scored instead of using a simple template match.
Most traders can spot a triangle or flag after the move is already underway. AI chart pattern recognition flips that by scanning thousands of charts and ranking the cleanest setups before the breakout. The edge isn’t “magic predictions”—it’s faster filtering, more consistent rules, and fewer missed alerts.
How AI Detects Chart Patterns in Real Time
AI pattern recognition trading systems don’t “see” charts like humans do. They translate price into math: swing points, slopes, volatility, and the probability that the structure matches a known pattern family.
What the model actually measures
A solid AI chart scanner typically builds pattern candidates from these ingredients:
- Swing highs/lows (pivots): Detected via fractal rules (e.g., a high with two lower highs on each side) or adaptive pivot logic based on ATR.
- Trendlines and channels: Fitted using regression or robust line fitting (to reduce outlier influence).
- Contraction/expansion: Volatility compression (ATR or Bollinger Band width) often defines triangles and flags.
- Time symmetry: Many patterns have “rhythm”—left and right shoulders, or flag duration relative to the pole.
- Breakout validation: Close beyond boundary, follow-through, and sometimes volume/OBV confirmation.
Actionable tip: If your scanner allows it, require a breakout candle close beyond the boundary (not just a wick) to reduce false positives, especially on BTC and ETH.
Pattern scoring beats yes or no
The best automatic pattern detection isn’t binary. It scores quality, such as:
- Touch count: At least 2 touches per trendline (3 is stronger).
- Slope sanity: “Flags” shouldn’t slope with the prior impulse too steeply; triangles should converge.
- Volatility regime fit: A flag after a strong impulse and rising ATR behaves differently than one in a dead range.
- Location: Patterns near major levels (prior highs/lows, VWAP bands) carry more signal.
Actionable tip: Build a watchlist rule: only trade patterns with a quality score above a threshold (e.g., top 20%) and aligned with the higher-timeframe trend.
AI Detection of Triangles and How to Trade Them
Triangles are compression patterns where the market is negotiating balance, often before a volatility expansion. AI tends to detect them more consistently than discretionary traders because it can quantify “convergence” and reject messy structures.
Symmetrical triangles
A symmetrical triangle typically shows lower highs and higher lows, converging toward an apex.
How AI detects it
- Identifies alternating pivot highs and lows.
- Fits two trendlines with opposite slopes.
- Confirms convergence by measuring the distance between trendlines shrinking over time.
- Often checks for declining ATR into the apex.
How to trade it (rule-based)
- Entry: Buy on a daily close above the upper trendline (or sell below lower trendline).
- Stop: Beyond the last swing inside the triangle (or 1.0–1.5x ATR).
- Target: Measured move = widest triangle height projected from breakout.
Example tickers
- BTC on the 4H: symmetrical triangles often resolve with sharp continuation when volatility has compressed for 20–40 candles.
- EUR/USD on the daily: triangles near macro pivots can break and then retest for cleaner entries.
Actionable tip: Avoid breakouts that occur too close to the apex (e.g., last 10–15% of the triangle). Breaks there statistically behave more “random” because liquidity thins and stops cluster.
Ascending and descending triangles
Ascending triangles (flat resistance + rising lows) often imply accumulation; descending triangles imply distribution.
What AI looks for
- One trendline slope near zero (flat).
- The other trendline sloping toward it.
- Repeated tests of the flat level (liquidity buildup).
Execution tactic
- Entry: Breakout close above resistance (ascending) or below support (descending).
- Stop: Inside the structure, beyond the last higher low/lower high.
- Add-on: If price retests the broken level and holds, add a second unit with a tighter stop.
Actionable tip: On AAPL, ascending triangle breaks are cleaner when the breakout day closes above the level and above VWAP, with volume above the 20-day average.
AI Detection of Flags and Pennants and How to Trade Them
Flags and pennants are continuation patterns built from two components: a pole (impulse) and a pause (tight consolidation). AI excels here because it can objectively define “impulse” and “tight.”
What defines a flag to an AI chart scanner
A robust model usually requires:
- Impulse magnitude: Pole move of a minimum size (e.g., 2.5–4.0x ATR) over a short window.
- Pullback constraints: Consolidation that retraces a limited portion of the pole (often 25–50%).
- Channel structure: Parallel lines (flag) or converging lines (pennant).
- Time constraint: Flags that last too long can become ranges; many systems cap duration (e.g., 5–30 candles depending on timeframe).
Actionable tip: If your AI chart scanner lets you set parameters, filter for flags where retracement is no deeper than 50% of the pole. Deep pullbacks often signal trend exhaustion, not continuation.
Trading flags: a repeatable playbook
- Entry A (aggressive): Buy at the lower flag boundary in an uptrend after a bullish rejection candle.
- Entry B (conservative): Buy on breakout close above flag resistance.
- Stop: Below the flag low (or below the rejection candle low).
- Target: Measured move = pole length projected from breakout.
Practical example
- ETH on 1H: after a $120 impulse, a $40 pullback flag (33% retracement) that breaks with rising volume often yields a clean measured move attempt.
Actionable tip: Take partial profits at 0.8x measured move and trail the rest using a 20 EMA or a 2x ATR stop; this reduces the pain of failed extensions.
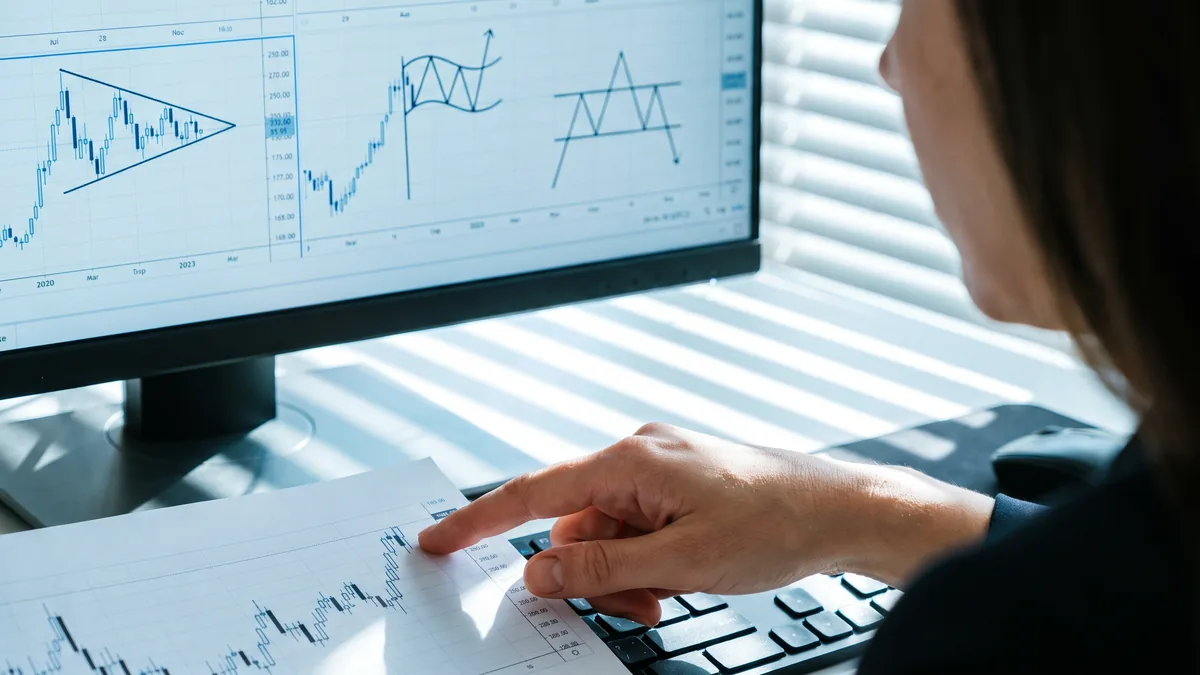
Flags fail for a reason—make AI show you why
Automatic pattern detection can over-label flags in choppy markets. Common failure conditions you can filter:
- Pole is weak (grindy, overlapping candles).
- Consolidation is not tight (ATR doesn’t contract).
- Breakout happens on low participation (no range expansion).
Actionable tip: Require breakout candle range to be at least 1.2x the average range of the prior 10 candles. That single filter removes many fake breaks.
AI Detection of Head and Shoulders Patterns
Head and shoulders is a reversal pattern that’s easy to “see” everywhere—so AI needs strict rules to avoid hallucinating structure. The good scanners don’t just match a silhouette; they score geometry and behavior.
How AI defines head and shoulders
Key components the model checks:
- Left shoulder: swing high, then pullback.
- Head: higher high than left shoulder, then pullback.
- Right shoulder: lower high than head, ideally near left shoulder height.
- Neckline: line through the two pullback lows (can slope).
- Break: close below neckline (for bearish H&S), often followed by retest.
Some systems also enforce:
- Time symmetry: right shoulder forms in a similar candle count as left shoulder (within a tolerance).
- Depth symmetry: pullbacks are reasonably comparable.
- Volume behavior: volume often fades from left shoulder to head to right shoulder, then expands on neckline break (more common in stocks than crypto).
Actionable tip: Treat neckline slope as a filter: a sharply rising neckline in a bearish H&S often reduces follow-through because demand is still stepping up.
Trading head and shoulders with defined risk
- Entry: Close below neckline, or retest-and-reject of the neckline from below.
- Stop: Above the right shoulder swing high.
- Target: Measured move = head-to-neckline distance projected downward.
Example
- AAPL daily: many tradable H&S breaks occur after an extended uptrend where the right shoulder fails to reclaim the 20-day moving average.
- EUR/USD 4H: H&S can work well when it aligns with a higher-timeframe resistance zone and a shift in rate expectations (macro catalyst).
Actionable tip: If you trade the retest entry, use a time stop: if price doesn’t move in your favor within 3–6 candles (timeframe-dependent), exit. Failed retests often snap back above the neckline.
Getting Better Results From AI Pattern Recognition Trading
Using a scanner doesn’t remove discretion—it changes where you apply it. The edge is in filtering, confirmation, and execution discipline.
Build a simple confirmation stack
Instead of adding ten indicators, use a compact checklist:
- Trend context: Trade continuation patterns (flags/triangles) in the direction of the 50/200 MA alignment.
- Volatility filter: Prefer setups where volatility contracted during the pattern and expands on the break.
- Level confluence: Prior swing high/low, VWAP, or weekly level near the breakout line.
- Liquidity: Avoid thin hours (especially for forex around rollover) unless you specifically trade those conditions.
Actionable tip: For BTC, reduce false breakouts by waiting for a breakout close and a second candle that holds above the broken level (two-candle confirmation). It costs some R:R but improves win rate.
The biggest “gotcha”: data and timeframe mismatch
AI can flag a beautiful pattern on 15m that is meaningless against a daily supply zone. You want alignment.
- Use multi-timeframe validation: if the 1H shows a bull flag, check 4H trend and daily levels.
- Keep pattern rules consistent per market: crypto trades 24/7; forex has session structure; stocks have gaps and earnings.
Actionable tip: On EUR/USD, only take 15m pattern breakouts during London/NY overlap when liquidity is highest; you’ll see fewer stop-runs.
Free scanners vs paid scanners: what actually matters
Many traders search for a chart pattern scanner free and that’s fine for learning. The trade-off is usually control and reliability.
What to test in any tool
- Can you adjust pivot sensitivity and minimum touches?
- Does it provide invalidation levels (where the pattern is wrong)?
- Does it backtest pattern rules on the same timeframe you trade?
- Does it alert in real time with clear breakout criteria?
Tools and workflows
- Trading AI app scanner
- TradingView pattern tools and community scanners
- Broker platform scanners (varies by broker)
Actionable tip: Paper trade the same scanner settings for 30 setups per pattern type (triangle, flag, H&S). Track win rate, average R multiple, and where failures cluster.
Risk Management for Automatic Pattern Detection
Patterns are just trade ideas. Your P&L is driven by position sizing, stops, and how you handle false breakouts.
Standardize your risk in R multiples
Use a consistent risk unit:
- Risk 1R per trade (e.g., 0.5%–1.0% of account).
- Target at least 1.5R average across your system to survive streaks.
Actionable tip: If your historical win rate is ~40%, you generally need average wins above 2.0R (or strong skew with partials) to keep expectancy positive.
Place stops where the pattern is invalid
Good stops are not “comfortable”; they’re logical.
- Triangles: beyond the last swing inside the structure.
- Flags: beyond the opposite side of the flag (not just under the breakout candle).
- Head and shoulders: above right shoulder (bearish) or below right shoulder (inverse).
Actionable tip: Add a volatility buffer: place the stop 0.2–0.5x ATR beyond invalidation to reduce wick-outs, especially on ETH.
Plan for false breakouts
False breaks are common in crypto and around news in forex.
Practical defenses:
- Wait for a close beyond the level (not intrabar).
- Use retest entries when the market is noisy.
- Reduce size ahead of major events (CPI, FOMC, earnings).
Actionable tip: If you trade EUR/USD, avoid initiating new pattern trades within 15 minutes of high-impact releases unless your strategy is specifically news-based.
Frequently Asked Questions
How accurate is AI chart pattern recognition in trading
It varies by market and timeframe, but accuracy improves when patterns are filtered by trend and volatility rather than taken mechanically. Expect more false positives in low-liquidity or news-driven conditions. The best results come from scoring pattern quality and requiring breakout confirmation.
What is the best AI chart scanner for triangles
The best scanner is the one that lets you control pivot sensitivity, minimum touches, and breakout confirmation rules. Triangles scan well when the tool measures convergence, ATR contraction, and requires a close beyond the boundary. Test scanners on your timeframe using at least 30 historical examples.
Are head and shoulders patterns reliable with automatic detection
They can be reliable, but only when the detector enforces geometry rules like neckline definition, shoulder symmetry tolerances, and clear invalidation levels. Most “bad” signals come from forcing the pattern inside choppy ranges. Retest entries and higher-timeframe confluence improve outcomes.
Can I use a chart pattern scanner free for day trading
Yes, but free scanners often have limited parameter control and noisier alerts on lower timeframes. You can still day trade with them by adding strict filters like session timing, ATR contraction, and close-based breakouts. Paper trade first to quantify false breakout frequency.
References
- Edwards, R.D., Magee, J., & Bassetti, W.H. Technical Analysis of Stock Trends.
- Murphy, J.J. Technical Analysis of the Financial Markets.
- Bulkowski, T. Encyclopedia of Chart Patterns.
External Links
AI Pattern Recognition — Chart Pattern Detection | ChartAIScan How AI Detects Chart Patterns Better Than Humans Best AI Chart Pattern Recognition Tools, Ranked (2026) Real-Time Head-and-Shoulders Pattern Detection for AI Trading Strategies AI Chart Pattern Recognition — Complete 2026 Guide | ChartLense